
Hi all,
Thanks to everyone who compared solar storms in ‘Protect our Planet from Solar Storms’ – we now have results to share with you!
We have used your comparisons to rank 1100 solar storms in order of how complicated, or complex they appeared.
Figure 1 shows three solar storms from the ranking. The left-hand image is a less complex storm, the middle image is an average storm, and the right-hand storm is a highly complex storm.
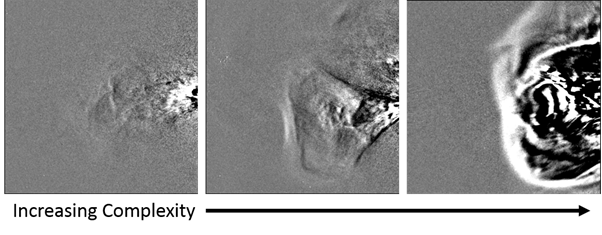
Figure 1: Three solar storms from across the complexity ranking.
The Sun has an ~11-year solar cycle, during which the number of sunspots (and solar storms) rises and falls. This can be seen in the bottom panel of Figure 2.
The top panel of Figure 2 shows the complexity of all 1100 solar storms plotted against the time the storm erupted from the Sun, for each of the two STEREO spacecraft. We have over-plotted yearly means, which clearly show that the average complexity of solar storms follows the sunspot cycle!

Figure 2: Top panel: complexity of solar storms over time, bottom panel: daily sunspot number.
Now we have established this, we are launching a new phase of the project – please help us compare solar storms with brightness adjusted images!
As usual, feel free to question us via the project Talk page!
Best wishes,
The Solar Stormwatch II team
