
Every four hours we pull all the data from incoming trace-it from the database, this give us a massive file with lines looking like.
20110601_014721_hiB_jmap_999,99437,2455712.838797814:43.66942148760331,2455712.707650273:40.36363636363637,2455712.5765027324:36.09366391184573,2455712.2996357013:29.757575757575758,2455712.0956284152:25.074380165289255,2455711.87704918:19.56473829201102,2455711.5710382513:14.46831955922865,2455711.3233151184:9.096418732782368
This is broken down as follows:-
- 20110601_014721_hiB_jmap_999 – the name of the jmap – identifies the latest data in the jmap, the camera and in this case that the data is for the ecliptic plane.
- 99437 – the code number for the user
- 2455712.838797814 the date [as a julian date] here 2011/05/31 08:7:52 GMT
- 43.66942148760331 the elongation angle measured from the image
These last two fields repeat as a pair for the entire profile.
The first process is some simple housekeeping where the result set in each profile is ordered in time and where people have clicked on two traces the line is split into two separate entries; there is a potential pitfall here if two profiles overlap in time and contributors are discouraged from doing this but this process at least allows this data to go forward.
The profiles are then collected into sets arranged by the earliest time in the profile, if from less that 10 degrees elongation, rounded to the nearest hour and split by spacecraft ahead or behind.
The next process counts the number of profiles in each of these bins, but also introduces the concept of a “good” profile that must have a least 3 points and span an elongation range of at least 5 degrees. A 7 hour running window is then computed over the count of good assets. Intervals are then identified where there are more than 10 profiles and the largest value in that range is then identified as an event.
For each event all results meeting the “good” criteria in a 7 hour running window are gathered together into a single file for the fitting process.
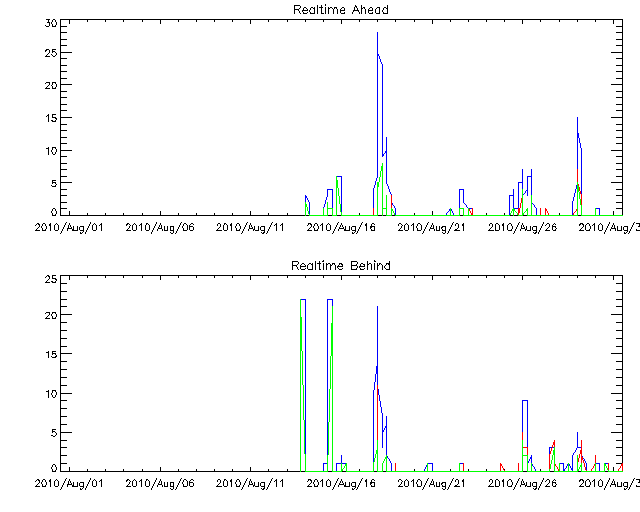
The plot shows for August 2010 in red the total number of profiles, in green the total number of “good” profiles and in blue the running total and shows three distinct events on the behind spacecraft and two on ahead.
In my next post I will discuss taking the clicks for a single profile and producing speeds and directions.
Steve
