
Finished working on automating the predictions from the clicks you give us on the incoming track it game and thought I would share with you some of the work you have been doing.
I have created a tool that allows me to plot all your clicks against a background of the realtime data you fitted – although of course I have the benefit to 20-20 hindsight, so the latest CME looked like this [the curve on the right hand side]

I also pick out clicks that failed to get through our event detection system, and for the same dataset that looks like

The near vertical feature is almost certainly due to instrumental effects, the near horizontal feature is a star or planet.
The data that does get through the event detection system is then passed to the data fitting system that shows the clicks and the fitted curve

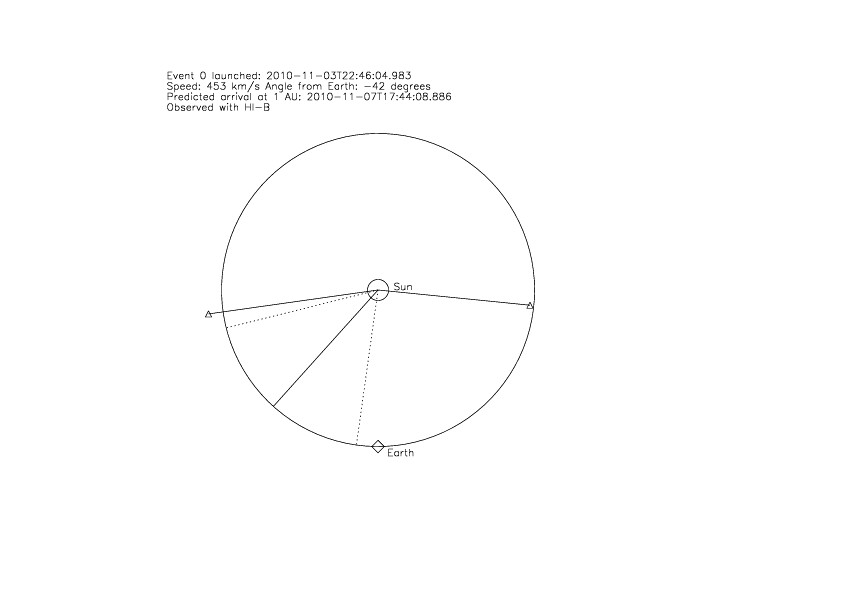
and finally the CME speed and direction is 452km/s 42 degrees from Sun-Earth line and arrives at 1 AU at 2010-11-07 17:44.
Similar plots for the most recent data give us.

and

again there are vertical instrumental features that should be ignored. No event in this time range has been seen far enough from the Sun for us to make a meaningful prediction and so things have been a bit quiet on that front. Clicking on tracks as they are starting is however very useful in the event it does develop into a CME since that gives really good statistics for the start point and helps to constrain the fitting process.
Steve

Thanks, Chris. Seeing the actual results is motivation to ‘keep on clicking.’
It’s good to get an explanation for those straight lines!